Data Visualizations: Overview
Background
Imagine you’re running a Hugo site, or some other static site generator-produced piece of web content. You want to be able to build beautiful, modern plots, on the fly. You want your less web-dev oriented staff to be able to do this as well with minimal effort.
I’m looking into making this a little easier for myself and my colleagues; many of us use Hugo already.
This first post will cover the approach to data visualization, and the development of a simple data visualization module. Further posts will act as dev logs, and advice for anyone trying to develop more modules in this style in the future. All of our data visualization code is open source, and can be found on GitHub!
Problem:
We are stuck between a rock and a hard place with respect to data visualization. We have a couple choices for visualizing data on the web. We could:
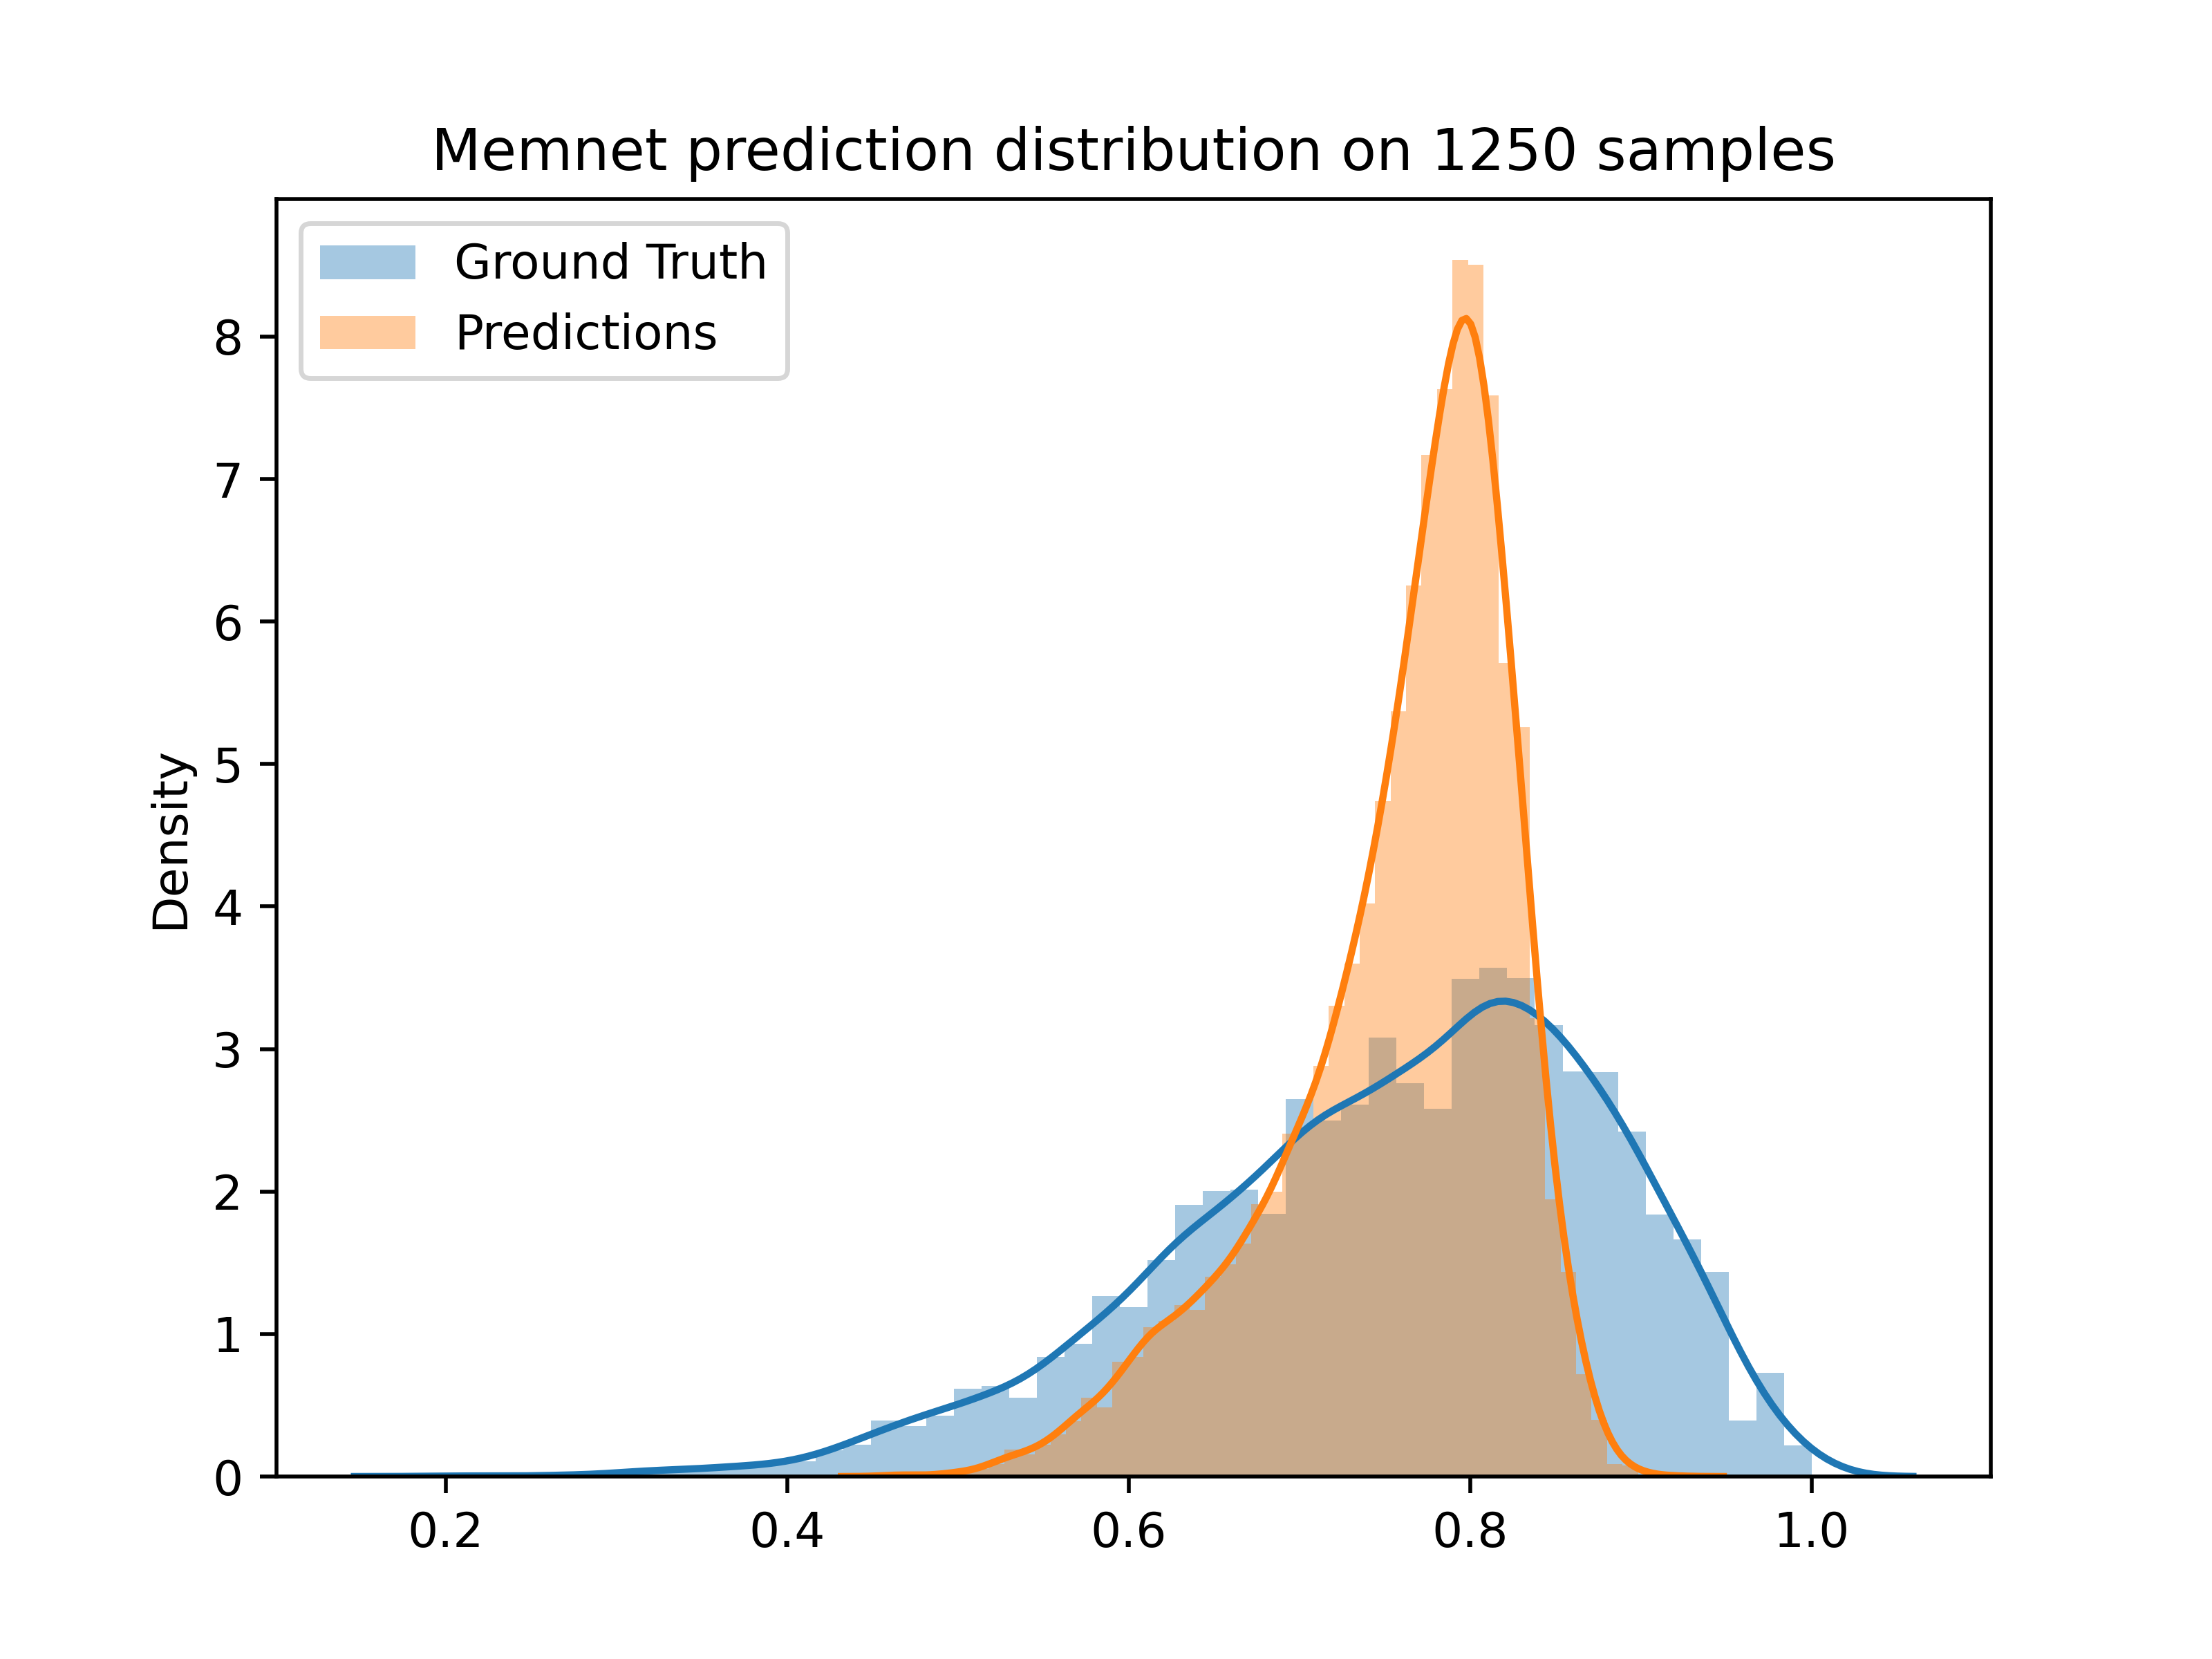
Do statistics locally, generate a plot as a graphic (usually PNG), and serve it as an image.
This results in a graph that looks like this:
Pros:
- Super easy to do, requires no internet and web dev related knowledge.
- You can work in your favorite chart making framework, and simply upload that image.
Cons:
- Even with a transparent background, changing the color scheme of the website does not change the colors of the chart, unless you do some magic with CSS filters, but they have limitations.
- Requires outside automation to ensure that you have the most up-to-date chart.
- Difficult to define alternate figures for small screens.
- Can only be animated with an embedded animation file, which is large, clunky, and rarely looks good on the web except in special cases, like if high frame rate is not needed, or the file size can otherwise be reduced.
- Interactivity is difficult to implement beyond a simple gallery of images.
We could:
Use observable, plotly, or some other outside framework.
Observable allows you to embed an iframe like this:
Pros:
- Very easy to embed, simply drop an iframe into your document!
- Looks good with low effort.
Cons:
- Making custom charts is just as difficult, if not more difficult due to the restrictions on a dev environment, than doing it yourself in D3.js.
- Noticeable loading time. Most of this is from Observable loading a bunch of cookies and tracking javascript files. This can be examined in the browser’s dev console.
- Corporate Watermark
- Doesn’t inherit site styles, styling has to be done on observablehq, and styles can’t be easily reused.
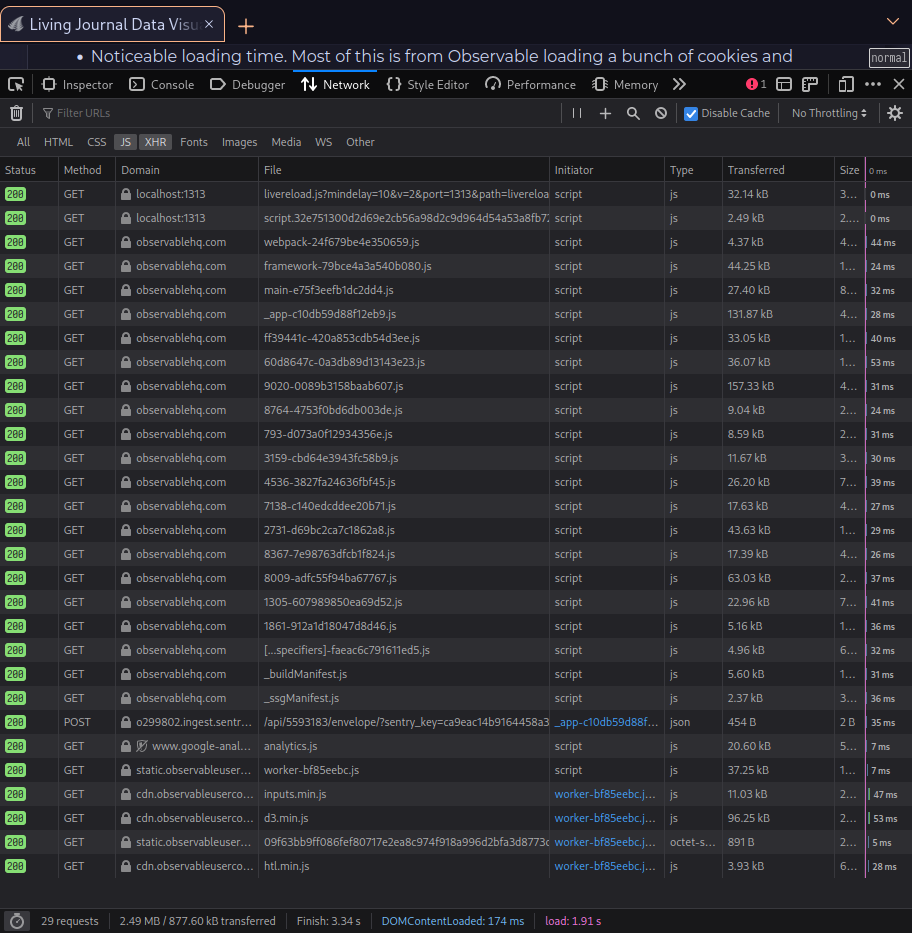
This is a list of every file this blog post is making you download when you load the page. Those first two from localhost are mine, all of the other scripts are from observable, and there’s more that don’t fit in the window. The additional load time (seen in the rightmost column, is about a tenth of a second. This is just for one plot, if you have many plots with other sources they will increase load time further. The analytics.js is mine.
The actual code in the markdown file for this post looks like this (admittedly, very easy to implement):
<div class="chart-container">
    <iframe width="75%" height="535" frameborder="0"
        src="https://observablehq.com/embed/@d3/sortable-bar-chart?cell=viewof+order&cell=chart"></iframe>
</div>
Observable also provides a very excellent simple plotting library for javascript called ObservablePlot, but it still requires some javascript programming, and we can’t do anything really interesting. They explicitly say the scope of ObservablePlot is for quickly visualizing tabular data. We will probably want more power than that in the long run.
We could:
Learn javascript, and use fancy frameworks like D3.js to draw a plot that does exactly what we want, and looks good too.
This’ll look something like this:
Titanic Passengers by Age
Pros:
- Looks good, since it renders in-browser.
- Integrates with the rest of the website well, here I just inherited the text color in my CSS, and called that variable from the javascript:
/* charts */
--bar-chart-fill: var(--text);
--bar-chart-axis: var(--subtext0);
let fill_color = getComputedStyle(document.documentElement).getPropertyValue('--bar-chart-fill');
let axis_color = getComputedStyle(document.documentElement).getPropertyValue('--bar-chart-axis');
let bar_padding = getComputedStyle(document.documentElement).getPropertyValue('--bar-chart-padding');
- Only loads a simple javascript file, a common javascript module (d3.js, which observable also loads), and a small data file.
Cons:
- I wrote about 75 lines of html and javascript to make that, very very simple histogram. D3.js is powerful at the expense of concise syntax. The full html/javascript file is here.
- D3.js is best used in a functional mode of programming, and authors may not be comfortable with that, many non-computer-science researchers get very far only practicing the imperative programming mode, and still should be able to use modern data visualization techniques. Even then, programming for the web is very different from running statistical tests in R or transforming data from an API in Python.
- Each chart needs to be programmed individually, which makes for a lot of code if you have a lot of data to show people.
I guess we’re stuck
Generally when we’re stuck like this in computer science, the solution is to add a couple assumptions to the mix. First, let’s assume that we’re using Hugo to write content for the web. This is a good assumption for me, because I use Hugo to run this site. Just from my own surveys of the ecosystem, it seems like a lot of younger, computationally minded scientists use Hugo as well. (I actually learned about it from a professor).
Hugo has this interesting system for defining macros while writing a post, which they term shortcodes.
When you call a shortcode in a blog post, it will be replaced with the entire contents of the associated html file.
In my actual markdown file for this blog post, I called the titanic chart like this:
{{< titanic >}}
You still had to write
titanic.htmlthough…
It turns out that shortcodes can also take parameters, so we can apply some variation when we’re writing. The syntax on the markdown side looks like this:
{{< titanic_param "Fare" >}}
Titanic Passengers by Fare
let column = "{{ .Get 0 }}"
Hugo lets us put these special strings into shortcode html (which here contains a <script> tag).
Now Hugo will replace this string with the first argument to the shortcode.
I thought Hugo was a static site generator. It builds all the files, stores them in a
publicfolder, and then acts as a simple http file server. Isn’t this decidedly a dynamic behavior if it can change that file before serving it?
Hugo is still acting static-ly here. Hugo already knows every shortcode that’s called and their parameters at build time. This means that if I call:
{{< titanic_param "Cabin" >}}
{{< titanic_param "Pclass" >}}
{{< titanic_param "Fare" >}}
When I push the blog post to github, my Hugo server will pull it down, and actually embed those three snippets into the final html page that’s served to you.
There’s a weird corollary to this behavior; we need to be really careful about scope.
Normally when we write javascript we want our variables to be accessible almost anywhere, but here, if we’re repeating the same code, we could have collision issues.
Luckily Javascript lets us define arbitrary scopes so long as we use the let keyword to define variables, and enclose each module in {braces}.
We also need to be careful about our IDs, we will want IDs to somehow be unique, luckily Hugo has a “random” function which will generate safe enough ids dynamically at build time.
<!-- layouts/shortcodes/rid.html -->
<p class="focus">
    {{ index (seq 1024 | shuffle) 0 | md5}}
    <!--I added md5 here to make the random numbers look interesting, but we can't possibly fill the whole space of md5-->
</p>
So we end up with this semi-compiled system, where we have directives that compile into javascript, which is then run interactively on the page.
9dcb88e0137649590b755372b040afad
a8ecbabae151abacba7dbde04f761c37
caf1a3dfb505ffed0d024130f58c5cfa
Hold on, to get a random number generator we need to shuffle a 1024-item sequence? Really? The chance of collisions are far too high to trust this in the wild. Not to mention how janky of a workaround this is. How is
shuffleimplemented? It must be getting a random number from the operating system somehow.
Hugo templates are really golang templates but with some custom bindings, and other systems that make them easier to work with. That being said, Hugo doesn’t really have a way to implement a custom templating function (without some serious hacking anyway). So, considering the jankiness and limitations of taking the random id approach, maybe we can find another option.
Hugo provides a .Page.Scratch variable, where we can drop any sort of page-level variables that need to be used by the shortcode or template and need to be visible to other shortcodes.
We could drop a variable in here and increment it every time.
Hugo also supplies a variable called .Ordinal though, which is replaced with the shortcode’s position in relation to its parent.
So if we do this instead:
<!-- layouts/shortcodes/oid.html -->
<p class="focus">
    This Shortcode's Ordinal ID is: {{ .Ordinal }}
</p>
When we call this three times, we do actually get different ids.
This Shortcode's Ordinal ID is: 10
This Shortcode's Ordinal ID is: 11
This Shortcode's Ordinal ID is: 12
This seems like a good way to generate ids for our figures, to keep each javascript snippet separate. We need to add one more trick though, Hugo allows us to call shortcodes within other shortcodes, so we should probably grab the parent name and ordinal too just to be safe. If the parent is the root node, we’ll want that to be recorded as well.
<!-- layouts/shortcodes/id_demo.html -->
<p class="focus">
    {{ $parent_flag := "root" }}

    {{ if .Parent }}
    {{ $parent_flag = printf "%s-%s" .Parent.Name (string .Parent.Ordinal) }}
    {{end}}

    {{ $child_flag := printf "%s-%s" .Name (string .Ordinal)  }}
    ID: {{ printf "%s-%s" $parent_flag $child_flag }}
</p>
ID: root-id_demo-13
And if we run this inside a dummy shortcode environment:
<!-- layouts/shortcodes/dummy.html -->
{{ .Inner }}
ID: dummy-14-id_demo-0
What if there are multiple layers? If we want to call a shortcode within a shortcode within a shortcode?
Then we’d need to be able to access the Parent’s Parent recursively. We don’t have functions in the template language, but maybe we can accomplish this with a scratch space and a loop? Go templates don’t allow for any infinitely long pipelines (they could cause infinitely long build times!) so we’ll have to use the trick from before to just make an arbitrarily long pipeline. We probably don’t need to give the root node a name anymore it can be implicit.
<!-- layouts/shortcodes/big_id_demo.html -->
<p class="focus">
    {{ .Scratch.Set "id" (printf "%s-%s" .Name (string .Ordinal)) }}
    {{ .Scratch.Set "curr_parent" .Parent }}
    {{ range seq 1024 }}

        {{ if ($.Scratch.Get "curr_parent") }}
            {{ $parent_id := printf "%s-%s" ($.Scratch.Get "curr_parent").Name (string ($.Scratch.Get "curr_parent").Ordinal) }}
            {{ $.Scratch.Set "id" (printf "%s-%s" $parent_id ($.Scratch.Get "id")) }}
            {{ $.Scratch.Set "curr_parent" ($.Scratch.Get "curr_parent").Parent }}
        {{ else }}
            {{ break }}
        {{end}}

    {{ end }}
    ID: {{ .Scratch.Get "id" }}
</p>
Calling the shortcodes like this at different layers shows us how this works.
{{< dummy >}}
{{< dummy >}}
{{< big_id_demo >}}
{{< /dummy >}}
{{< dummy >}}
{{< big_id_demo >}}
{{< /dummy >}}
{{< /dummy >}}
ID: dummy-16-dummy-0-big_id_demo-0
ID: dummy-16-dummy-1-big_id_demo-0
The outer dummy environment is shortcode number 16 on the page, named dummy, and each inner dummy environment is numbered relative to the parent. You’ll notice that technically this is limited to a depth of 1024. I doubt we’ll need that level of recursion, so I’m going to call it good.
I don’t really want to have to put this code in the top of every shortcode I write, so we’ll define a partial real quick to save it as a macro. We’ll put this in the distributed module as well.
<!-- layouts/partials/assign_id.html -->

    {{ .Scratch.Set "id" (printf "%s-%s" .Name (string .Ordinal)) }}
    {{ .Scratch.Set "curr_parent" .Parent }}
    {{ range seq 1024 }}

        {{ if ($.Scratch.Get "curr_parent") }}
            {{ $parent_id := printf "%s-%s" ($.Scratch.Get "curr_parent").Name (string ($.Scratch.Get "curr_parent").Ordinal) }}
            {{ $.Scratch.Set "id" (printf "%s-%s" $parent_id ($.Scratch.Get "id")) }}
            {{ $.Scratch.Set "curr_parent" ($.Scratch.Get "curr_parent").Parent }}
        {{ else }}
            {{ break }}
        {{end}}

    {{ end }}
<!-- layouts/shortcodes/partial_id_test.html -->

{{ partial "assign_id.html" . }}
<blockquote class="focus">
    ID: {{ .Scratch.Get "id" }}
</blockquote>
And a quick test inside a dummy…
ID: dummy-17-partial_id_test-0
It works! Now we can programmatically prevent id collisions! This will give us a lot more freedom to abstract behavior from html/css/javascript to Hugo shortcodes.
Environments
We used a dummy environment to demonstrate the id collision prevention, but we can use these environment shortcodes to accomplish a lot more.
We can create an environment we’ll call “hflex” (Horizontal-Flex), and construct some css and html that will make charts inside that environment render side-by-side.
<!-- layouts/shortcodes/hflex.html -->
{{ partial "resource.html" (dict "context" . "type" "css" "filename" "css/data-vis.css") }}
{{ partial "assign_id.html" . }}

<div class="vis-flex" id='{{ .Scratch.Get "id" }}'>
    {{ .Inner }}
</div>
The “resource.html” partial is not pertinent to the point, but it’s included here. It’s a shortcode I have that automatically manages css fragments like this. This way, the page will only load css code that’s relevant to the content. The css we need to add looks like this:
/* assets/css/data-vis.css, irrelevant entries omitted */

.vis-flex {
    display: flex;
    flex-direction: row;
    width: 100%;
}

.vis-flex .chart-container {
    flex: 1 1 30%;
    height: 100%;
    width: 100%;
}

.chart-container {
    width: 100%;
    aspect-ratio: 1.61;
    margin: auto;
}


.vis-flex .chart {
    height: 100%;
    width: 100%;
    display: inline-block;
}

.chart {
    height: 100%;
    width: 100%;
    margin: auto;
    display: inline-block;
}
/* forces h-flex to actually be v-flex on mobile because otherwise the plots are too small */
@media (max-width: 940px){
    .vis-flex {
        flex-direction: column;
    }
}
This will have the effect of forcing every chart to fill the available space. In the javascript we will assign svg sizes in the document’s on-ready hook, and assign view boxes to the chart container. This way our charts will automatically scale with their container size.
Now in markdown we can call:
{{< hflex >}}
{{< titanic_param "Fare" >}}
{{< titanic_param "Age" >}}
{{< /hflex >}}
And our generated figure looks like this:
Titanic Passengers by Fare
Titanic Passengers by Age
In order for this to work, we need to adopt another standard for our d3.js code.
All of the figure generating code should be wrapped in a $(document).ready() function.
This is good practice for the web anyway, it prevents race conditions, which in our case can cause the chart sizes to be calculated incorrectly
We also must stray from the standard advice to size our plots using .attr("width") and .attr("height").
Instead we use this pattern:
let tarchart = $('#{{ .Scratch.Get "id" }}')
let margin = {top: 10, right: 30, bottom: 30, left: 40},
    width = tarchart.width() - margin.left - margin.right,
    height = tarchart.height() - margin.top - margin.bottom;
let rheight = height + margin.top + margin.bottom;
let rwidth = width + margin.left + margin.right;

let svg = d3.select('#{{ .Scratch.Get "id" }}')
    .append("svg")
    .attr("viewBox", `0 0 ${rwidth} ${rheight}`)
    .append("g")
    .attr("transform",
        "translate(" + margin.left + "," + margin.top + ")");
Which we can codify into a module later. This will construct a view-box that sits within the parent element, and allows the svg to change size in a programmatic way, rather than having to size the svg manually to some fixed number of pixels.
Implementing a Namespace
There’s one more trick I want to introduce before we start developing these plugins for real.
While we can implement a lot of complex behaviors using only nested shortcodes like above, we also need to be able to move data around at the javascript level.
This will make it easier to make modules that interact with each other, and make it easier to pass data from one object to another.
We can demonstrate this with a minimal example.
We’ll create a pair of shortcodes that communicate with each other using a global variable, which we’ll call mainData.
We’ll then implement the mainData object in such a way that the author can use it as a namespace.
Since each of our html snippets are embedded into the final document at compile time, all of the shortcodes will share the same mainData, so long as they’re on the same page.
<!-- layouts/shortcodes/enter_string.html -->
<label for="{{ .Get 0}}"></label>
<input name="entrybox" id="{{ .Get 0}}" type="text" value="dingus">
<!-- create a text entry box, with a simple id. For more complex situations we'll need to generate an id like we did earlier.-->

<script type="text/javascript">
    if (typeof mainData === 'undefined'){
        mainData = {}; // Note that in other places we use let for all initializations. Here we want mainData to be global so we have to initialize it implicitly.
    }
    idstring = "{{ .Get 0 }}"
    $("#" + idstring).on('change keyup paste', function() {
        mainData[idstring] = $( this ).val();
    }) // on every key even or change event in the box, we want to send that data to mainData.idstring

    // The loading function needs to be bound to the document load as well. In the future it will be better to define
    // the function in a place where it is easy to reuse in cases like this.
    $( document ).ready(function (){
        mainData[idstring] = $( "#" + idstring ).val();
    })

</script>
<!-- layouts/shortcodes/display_string.html -->
<p class="focus text" id="protected_text"></p>
<!-- First, create a text element with a target-able id-->
<script type="text/javascript">
  if (typeof mainData === 'undefined'){
    console.log("Could not find the mainData object, are you sure you ran a data loading shortcode?")
  } // a little bit of debugging help

  idstring = "{{ .Get 0 }}"
  $("#" + idstring).on('change keyup paste', function() {
      $("#protected_text").text(mainData["{{ .Get 0 }}"])
  }) // watch the input box for updates, at which point, pull data from the namespace
  $( document ).ready(function () {
      $("#protected_text").text(mainData["{{ .Get 0 }}"])
  }) // do the same thing on document load
</script>
In the markdown file, we can insert these snippets with:
{{< enter_string text1 >}}
{{< display_string text1 >}}
And when we call those shortcodes we get this, try entering text!
This seems convoluted. Since we’re watching the string entry box anyway, why do we need to move data through
mainData? Can’t we just read it directly from the entry box using jquery?
Yes! In this minimal case, that would be a lot simpler.
That being said, not every case will be this simple.
Since this framework is for data visualizations, we need to have a good way to store entire data frames, and access them freely from different shortcodes.
For many cases we can have a rendering shortcode reference a control shortcode directly, and this should be preferable to using mainData, but this will be a powerful fallback tool for when we need it.
The Count Plot
Now that we’ve laid the groundwork, let’s make an actual data visualization module!
Before we pulled data from the titanic dataset. This is a classic dataset for teaching, but it’s pretty contrived.
We also baked it into the html for the earlier examples, and we don’t want to have to do that in the future.
Let’s start by writing a standalone shortcode that loads a dataset from the website’s own server into memory.
This should be the simplest “base” case for data management.
For demonstration purposes, we’ll grab a survey from Pew Research.
Pew, like most stuffy, old-fashioned, institutions insists on using a proprietary data format that they license from IBM (SPSS).
I’ll convert it to a format that’s somehow more modern and more old-fashioned, plain text.
Note this requires a plugin for pandas pyreadstat.
import pandas as pd
stat = pd.read_spss("ATP W93.sav")
stat.to_csv("ATPW93.csv") # Note that pew also put a space in the filename
Then we place it somewhere Hugo can get to it.
This means your content, static, or media folder.
I like to put it in content, that way I can organize things by project.
In a real life situation, you’ll want to do some more preprocessing on your dataset before simply uploading it to the internet. This means you should remove columns you don’t use, and if you know you’ll only make visualizations on the subset, you should just upload the subset. This has the benefit of making the site load faster, and it makes it so that someone can’t download the whole dataset just by asking your server for it. Remember, if you upload something to a Hugo server, Hugo will just serve it to whomever asks for it. Access is not limited to what is explicitly shown in the website content. So before I upload this, I’ll pull out just the columns we’re interested in.
import pandas as pd
stat = pd.read_spss("ATP W93.sav")
out = stat.filter(regex="(NEWSPLAT|SOCIALNEWS|F_)")
# NEWSPLAT marks columns about platforms, SOCIALNEWS is about getting news from social media, F_ is demographic info
out.to_csv("w93_filt.csv")
There’s two ways we could load the csv, both fairly simple, but the choice will effect how we build the whole framework.
We could load it into the mainData variable with a name, like we talked about earlier.
This would look like:
<script>
{
    // Note that I declare link and variable explicitly, but mainData is declared implicitly.
    // This ensures they don't collide with other uses of load_csv.
    // We can think of explicit declarations staying in the shortcode,
    // and explicit ones as being global to the page.

    let link = "{{ .Get 1 }}";
    let variable = "{{ .Get 0 }}";
    if (typeof mainData === 'undefined') {
        mainData = {};
    }
    mainData[variable] = d3.csv(link);
} // These braces around the whole script keep the `var` declarations from escaping the scope of the shortcode.
</script>
Or we could try to define a block where the csv can be accessed implicitly.
<script>
{
    let link = "{{ .Get 0 }}"
    if (typeof scopeData === 'undefined') {
        let scopeData = d3.csv(link); // This time we do want it to stay in scope
    }
    {{ .Inner }} // run whatever codes are in the block
} // close the block
</script>
I think we don’t really gain anything by making this an environment, on the one hand we don’t need to declare a variable, but on the other hand it might be difficult to use multiple data sources in one visualization, and we’d have to declare the scopeData every time we want to use that dataset.
It might just make things trickier for the author, so I think we’ll just declare a variable name.
We might find scoped data to be useful later in development though, so we will remember this trick.
Nested shortcodes are one of Hugo’s superpowers, but this is probably not the place for them.
Alright now we’ll need to make a simple count plot. First let’s do it the naive way. We’ll write a shortcode that takes in a csv (which we’ll declare with the variable name), and a column name in that csv, and displays a nice count plot.
<!-- first we load the csv into a variable "pew_data" -->
{{< load_csv "pew_data" "../data/w93_filt.csv" >}}
<!-- then make a countplot from a specified column! -->
{{< countplot "pew_data" "F_MARITAL" >}}
To prove that’s not a fluke we can make another one, we don’t need to load the data this time so it’s just:
{{< countplot "pew_data" "F_METRO" >}}
Bells and Whistles
First, we need titles and axis labels. Although all of our prior examples have been black and white, since they are simple charts, we will need to be able to specify colors and make legends easily as well. For some charts, these should probably be generated automatically, with an override option for special cases. In order to add something like that, we need to make a decision about how an author should invoke “modifiers” like this to a chart shortcode.
Here are the options:
We could create a “chart” environment shortcode, which would be invoked like this:
{{< chart >}}
    {{< title "PEW Research Respondants by Metropolitanism" >}}
    {{< countplot "pew_data" "F_METRO" >}}
{{< /chart >}}
While technically ggplot2 for R uses objects and operations, it’s syntactically similar to environments like this. In ggplot2 we create a ggplot object and then add features to it.
We could have the relationship between shortcodes be defined implicitly:
{{< title "PEW Research Respondants by Marital Status >}}
{{< countplot "pew_data" "F_METRO" >}}
This works a lot like matplotlib’s pyplot feature, where there’s an object behind the scenes whose properties are edited through functional side effects.
Or we could control things using keyword arguments
{{< countplot "pew_data" "F_EDUCCAT" title="PEW Research Respondants by Education" >}}
This works most like Observable Plot in javascript, where an object full of settings is passed to a plot constructor.
In Hugo, we would parse each of these modes of operation in very different ways.
In the environment-based method, we would need to identify the parent chart and attach objects to it.
Luckily we already made a system for mapping out the shortcode tree earlier, so we know that identifying parent nodes out to 1024 layers deep is simple in Hugo.
In the implicit method, we can make each of our shortcodes add information onto a hidden object, probably in the .Scratch, and then have the plotting method pull data from its .Parent.Scratch.
This would work, but we’d have to implement a partial that can handle this in all cases, since we won’t want to reimplement the system in every plotting shortcode.
In the keyword argument method, we can define a partial that parses the keywords, but given that Hugo doesn’t have a built-in way to create objects and pass them to shortcodes, I feel this system would quickly become unwieldy in this context.
While writing the shortcode for countplot I encountered a bug where the target column was not being properly parsed, Hugo was inserting spaces into the control string! This is because unlike in other programming languages, whitespace is not free in Go templates.
Because of the ambiguity in string parsing, I worry that having a very long list of keyword arguments without the ability to insert whitespace will lead to more mistakes and more time debugging down the line.
Even though the syntax is more verbose, I think that the environment driven system will work best for us.
It avoids ambiguity, which helps authors learn the system, and I feel it will make it harder for me to make mistakes while constructing shortcodes.
So let’s get started making our chart environment.
{{ partial "assign_id.html" . }}
<!-- it might seem silly to assign the id to the environment that doesn't really do anything. But we can easily access it with .Parent.Scratch from nested shortcodes now. -->

<div class="chart-container">
    <div class="chart bar-chart figure" id='{{ .Scratch.Get "id" }}'></div>
</div>
<script type="text/javascript" >
        // Check for a chartspace, and if it doesn't exist, then make it
        if (typeof chartSpace === 'undefined') {
            var chartSpace = {}; // This one should be var because we want it to be global
        }
        // Create a namespace to adjoin to chartSpace
        chartSpace['{{ .Scratch.Get "id" }}'] = {};
        // So I don't have to type out the id every time:
        localChart = chartSpace['{{ .Scratch.Get "id" }}']
        localChart.tarchart = $('#{{ .Scratch.Get "id" }}')
        localChart.fill_color = getComputedStyle(document.documentElement).getPropertyValue('--bar-chart-fill');
        localChart.axis_color = getComputedStyle(document.documentElement).getPropertyValue('--bar-chart-axis');
        localChart.bar_padding = getComputedStyle(document.documentElement).getPropertyValue('--bar-chart-padding');
        localChart.margin = {top: 10, right: 30, bottom: 30, left: 40},
            width = tarchart.width() - margin.left - margin.right,
            height = tarchart.height() - margin.top - margin.bottom;
        localChart.rheight = height + margin.top + margin.bottom;
        localChart.rwidth = width + margin.left + margin.right;

        localChart.svg = d3.select('#{{ .Scratch.Get "id" }}')
            .append("svg")
            .attr("viewBox", `0 0 ${rwidth} ${rheight}`)
            .append("g")
            .attr("transform",
                "translate(" + margin.left + "," + margin.top + ")");
</script>

{{ .Inner }}
We basically just put all of the d3js boilerplate we’ve designed so far into a new namespace that’s linked to the chart id. Now we can remove that boilerplate code from countplot.html and replace all of the chart references with references to the chart namespace. Then we can simply get the chart id from the parent and…
Wait, this doesn’t work. Hugo shortcodes are rendered inside out. Child shortcodes are rendered before their parents. So you can’t pass data down the shortcode tree, only up.
Ah, this poses a bit of a problem for us. The nesting syntax works really well for what we want to do. We also don’t want to just offload everything to javascript, since things will slow down as we add more features… We’ve coded ourselves into a corner.
We could solve this in a couple of ways.
We could re-write assign_id.html to, instead of finding the current shortcode, find the closest chart context.
This would restrict us to having only one chart per chart context, but maybe that’s okay.
We might want to use the “true” id later, so we’ll probably just add another variable to the Scratch that gives us a “chart id” instead of a “shortcode id”.
/* partials/assign_id.html
This part is inside the inner loop, right after we append the current parent id to the target id */

{{ if eq ($.Scratch.Get "curr_parent").Name "chart" }}
    {{ $.Scratch.Set "chart_id" $parent_id }}
{{ end }}
Now we can simply replace "id" with "chart_id" in our countplot shortcode, and invoke with:
{{< chart >}}
    {{< countplot "pew_data" "F_PARTY_FINAL" >}}
{{< /chart >}}
I’m still confused, how will we add titles and other bells and whistles now? The whole
{{ .Inner }}is below the target div, so we can’t just insert html snippets.
While we can’t pass data down the tree, we can pass data up the tree. So to build a title shortcode, we could just pass that data up to the chart and render it there.
/* shortcodes/title.html */
{{ $title = .Get 0 | markdownify }}
/* if the parent is a chart env, then offload title rendering to it, otherwise render the title straight up */
/* this will let us title the layout environments like hflex that we made earlier */
{{ if eq .Parent.Name "chart" }}
    {{ .Parent.Scratch.Set "title" $title }}
{{ else }}
    <h3 class="chart-header">Titanic Passengers by {{ .Get 0 }}</h3>
{{ end }}
Then we add this to the div for chart.html:
<div class="chart-container">
    <h3 class="chart-header">{{ .Scratch.Get "title" }}</h3>
    <div class="chart bar-chart figure" id='{{ .scratch.get "id" }}'></div>
</div>
And we can invoke this with:
{{< chart >}}
    {{< title "*How often do you get your news from Telelvision?*" >}}
    {{< countplot "pew_data" "NEWSPLAT_a_W93" >}}
{{< /chart >}}
How often do you get your news from Television?
So we can exploit this feature of Hugo, that shortcodes render inside out, and use it to add whatever features we want through these nesting environments. The environments being specialized in this way also allows us to define polymorphic behavior based on the environment we invoke it in. The Go template language is also powerful enough for us to build simple parsers, and we can make shortcodes simply run a javascript snippet!
Interactivity
This post has gotten fairly deep in the weeds already, but there’s one more topic I want to show off before we wrap up.
I showed a simple string entry and display widget ecosystem earlier, but here’s how we can integrate that into the actual data visualizations.
I haven’t fully considered how I want interactivity data to be passed to the chart, but for now I’m building interactivity widgets in the same way as the data loading shortcode, where they’re fully separated from the chart environment, and control information is passed through the mainData namespace.
{{< column_selector "pew_data" "demo_column_1" "Choose Variable:" >}}

{{< chart >}}
    {{< countplot "pew_data" "demo_column_1" >}}
{{< /chart >}}
The mechanics of this turn out to be fairly complicated, you can find annotated code for the countplot side here and the column selector side here
We can also use the column selector as part of the data processing pipeline. We’ll make a shortcode that filters the dataset for example:
{{< column_selector "pew_data" "demo_column_1" "Choose Variable:" >}}
{{< filter "pew_filt" "pew_data" "demo_column_1" >}}

{{< chart >}}
    {{< countplot "pew_filt" "F_PARTY_FINAL" >}}
{{< /chart >}}
Respondants in filtered column by party affiliation
This works about 95% of the time. There’s a timing bug that we’ll fix in a refactor.
All of a sudden the horizon of what we can do with Hugo shortcodes has expanded to include writing automation features that aren’t even discussed in the Hugo community today. Other modules like hugo-chart still require the author to write javascript, and balk at automating a number of chart features.
For the next entry in this series, we will explore how to apply these principles to more interesting chart typologies, specifically maps! We’ll also add some more bells and whistles to our chart environment.